
How Restaurant Sales Analytics Software in Singapore Helps F&B Operators Make Better Decisions
Most F&B and retail operators in Singapore are not short of data. They are short of decisions. A typical outlet already produces transaction records, item…
Most F&B and retail operators in Singapore are not short of data. They are short of decisions.
A typical outlet already produces transaction records, item-level sales, payment timestamps, QR ordering data, delivery orders, member sign-ups and voucher redemptions every single day. The problem is that this information usually sits in different places — a POS terminal here, a spreadsheet there, a WhatsApp chat with a supplier, a loyalty app nobody checks. When Monday morning arrives, the manager still has to answer basic questions by instinct: Which items are actually making money? Which customers have stopped coming back? Was last month's promotion worth running?
Restaurant sales analytics software matters not because it produces prettier charts, but because it shortens the distance between a number and an action. This article looks at what that looks like in practice for Singapore restaurants, cafes, retail stores and multi-outlet groups.
Why more reports don't automatically mean better decisions
There is a common pattern in F&B operations. An owner invests in a POS system, discovers it can generate dozens of reports, and then stops opening most of them. The reports are accurate but disconnected. Sales by hour does not connect to which customers bought. Discount totals do not connect to whether those customers returned. Membership numbers do not connect to actual visit frequency.
The result is decision fatigue. Operators default to the simplest levers available: blanket discounts, a new poster, another set meal. These are not wrong, but they are blunt. A blanket discount trains regulars to wait for discounts and gives away margin on customers who would have paid full price anyway.
Analytics becomes useful when it narrows the field of options. Instead of "sales are down, let's do a promotion", the question becomes "which specific group of customers, contacted through which channel, with which offer, is most likely to change behaviour this month?"
The five questions restaurant sales analytics should answer
Before evaluating any tool, it helps to define the decisions you actually need to make. For most Singapore F&B and retail operators, five questions cover the majority of day-to-day choices:
1. What is selling, and at what margin? Item-level sales mixed with cost data shows which menu items or SKUs deserve prominence and which quietly drain kitchen or shelf capacity.
2. When are customers actually coming? Hourly and day-of-week patterns inform staffing, prep levels and whether a quiet weekday lunch needs a specific offer rather than a generic one.
3. Who is coming back, and who has stopped? This requires POS data linked to a customer or member record — visit frequency, last visit date, average spend and preferred outlet.
4. Which promotions produced repeat behaviour? Redemption counts alone are weak evidence. The stronger measure is whether customers who redeemed came back again without a discount.
5. How do outlets compare, fairly? A mall outlet and a neighbourhood outlet face different footfall, rent and customer mixes. Comparison needs context, not raw ranking.
If your current reporting cannot answer these, more dashboards will not fix it. What is missing is connection between transaction data, customer data and campaign data.
What has to be connected before the numbers become useful
Practical analytics depends on three data layers being linked.
The first is transaction data from the POS: what was sold, when, at which outlet, at what price, and with what discount. The second is customer data from CRM and loyalty: who bought it, whether they are a member, how often they visit and which vouchers they hold. The third is campaign data: what was sent, to which segment, through which channel, and what happened afterwards.
When these three layers sit in separate systems, analysis is manual and slow. When they are connected, questions that used to take a week of spreadsheet work can be answered in a single view.
This is where Amfuture's positioning is relevant. Amfuture helps connect POS, CRM, loyalty, WhatsApp marketing and analytics workflows so that daily sales, member, voucher and campaign data can be reviewed together rather than in isolation. For operators, the practical benefit is not the software itself — it is being able to see, for example, that a specific group of members last visited six weeks ago and that a targeted WhatsApp voucher is a more sensible next step than a storewide discount.
Data handling also matters. Customer contact details and purchase histories in Singapore fall under PDPA expectations, so consent records, opt-out handling and appropriate access controls should be part of the workflow, not an afterthought.
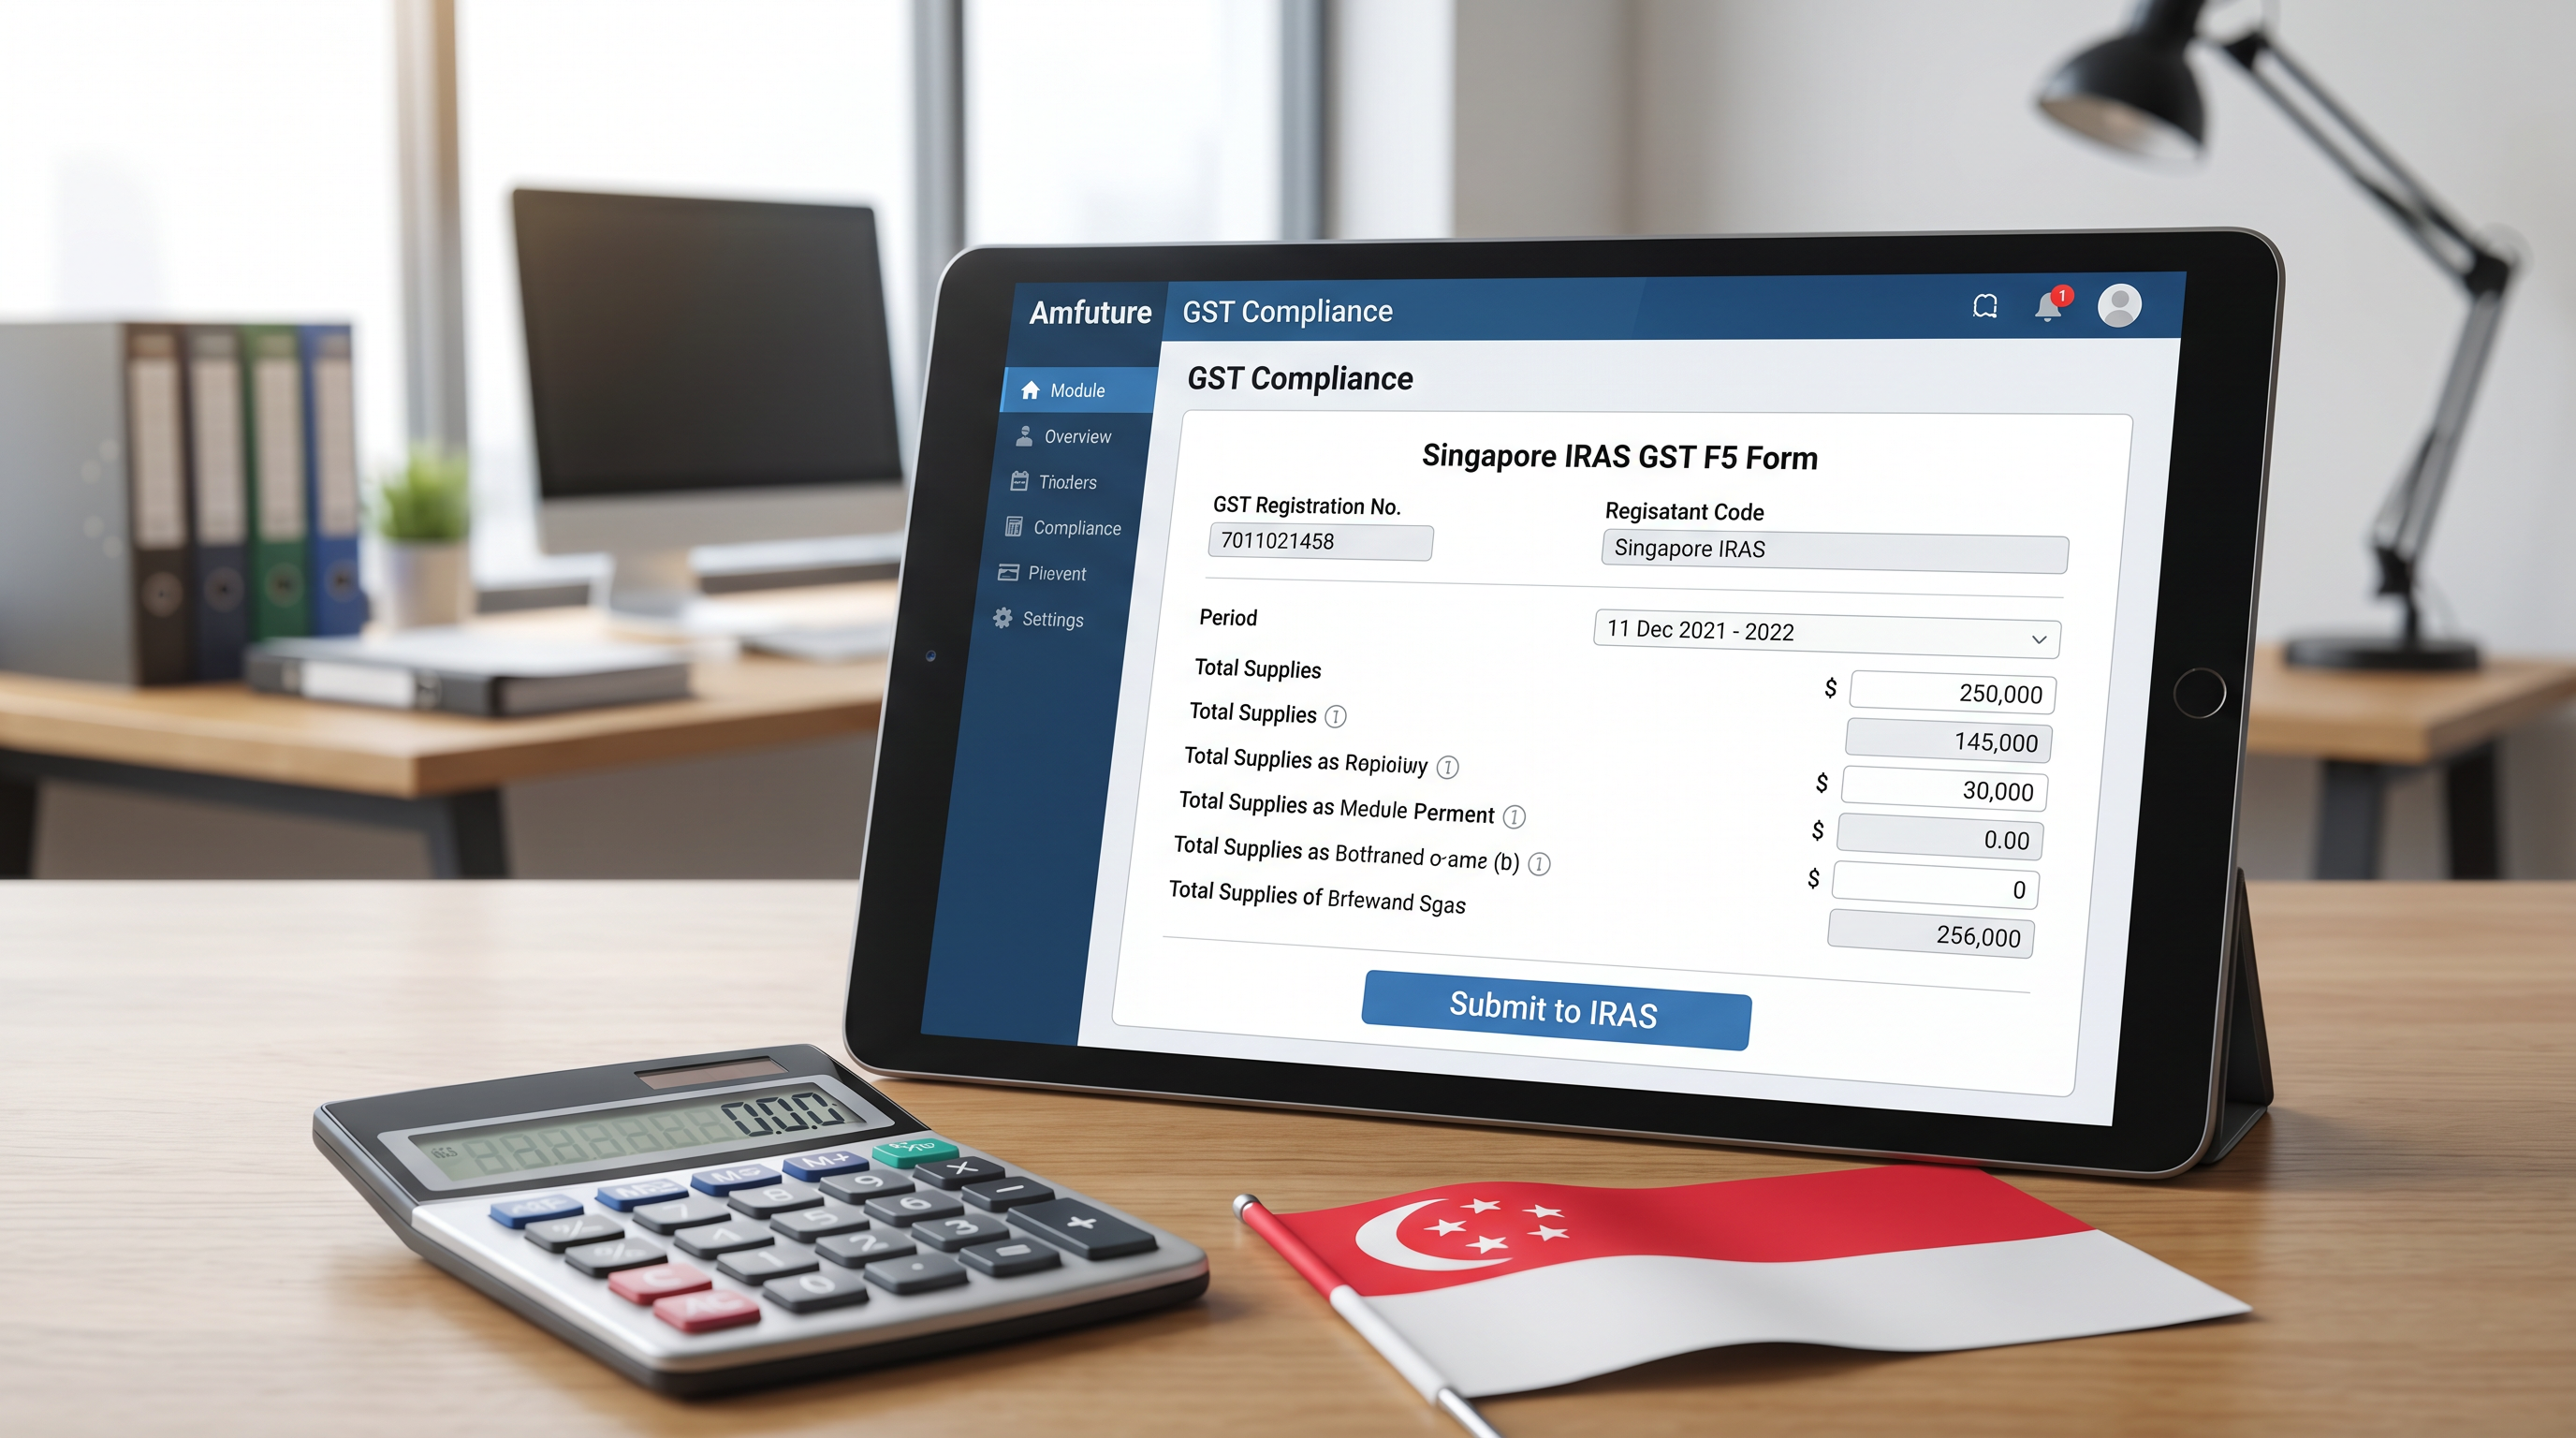
Illustrative scenarios: a cafe, a restaurant group, a retail store
A cafe notices weekday afternoon sales are flat. Item-level data shows drinks sell well but food attachment is low. Instead of discounting everything, the operator identifies customers who usually buy only a beverage and tests a small food-plus-drink bundle sent to a defined member segment, then checks whether those customers return in the following month.
A restaurant group with three outlets suspects one branch is underperforming. Outlet-level analytics show it is actually comparable on weekday dinner covers but weaker on weekend lunch. Staffing and prep decisions can then be adjusted for that specific daypart rather than applying the same changes across all three outlets.
A retail store runs a voucher campaign and sees strong redemptions. The more important metric is whether recipients return within a defined follow-up period without a new voucher. If they do not, the campaign bought a transaction rather than a customer.
These are illustrative situations, not promised outcomes, but they show the pattern: analytics is most valuable when it points to a specific, testable action.
Multi-outlet visibility without misleading comparisons
Multi-outlet operators often struggle with two extremes. Either every outlet reports differently, making consolidation painful, or everything is averaged into a single number that hides real differences.
A more useful approach is layered reporting: a group-level view for headline trends, and outlet-level views for daypart, category and customer behaviour. Store managers can then be measured on factors within their control — attachment rate, member capture rate, repeat visit rate — rather than only on total sales, which is heavily influenced by location and footfall.
Consistency also matters. If one outlet runs promotions manually and another follows a fixed process, campaign results become impossible to compare. Standardising how vouchers are issued, tracked and measured across outlets makes the data trustworthy.
Action steps: a practical checklist for operators
If you want better decisions from your sales data, start here:
Define three decisions you want to improve — for example, reducing inactive members, improving weekday footfall, or fixing a weak daypart.Check whether your POS data can be linked to a customer record. Without this, retention analysis is guesswork.
Audit your discount habit. Identify how much margin goes to customers who would have returned anyway.
Segment before you send. Separate new, active, lapsing and inactive customers, and treat each group differently.
Measure repeat visits, not just redemptions. The second purchase is the real signal.
Standardise promotion execution across outlets so results can be compared honestly.
Review your data handling for consent, opt-outs and access control.
Set a regular review rhythm — weekly for operations, monthly for retention and campaign performance.
Sales analytics software will not make decisions for you. What it can do is make the right decision far more obvious. For Singapore F&B and retail operators, the goal is a short, repeatable loop: read the data, choose a specific group of customers or a specific daypart, take one action, measure what changed, and adjust. Amfuture is built around connecting those daily sales, member, voucher and campaign signals so that loop takes minutes rather than weeks.